USGS Water Dashboard
This newly revamped dashboard can be extremely helpful in identifying or confirming flooding conditions when they occur.
Dashboard View
You can zoom in and reposition to a specifics area in order to view all water sensor locations.
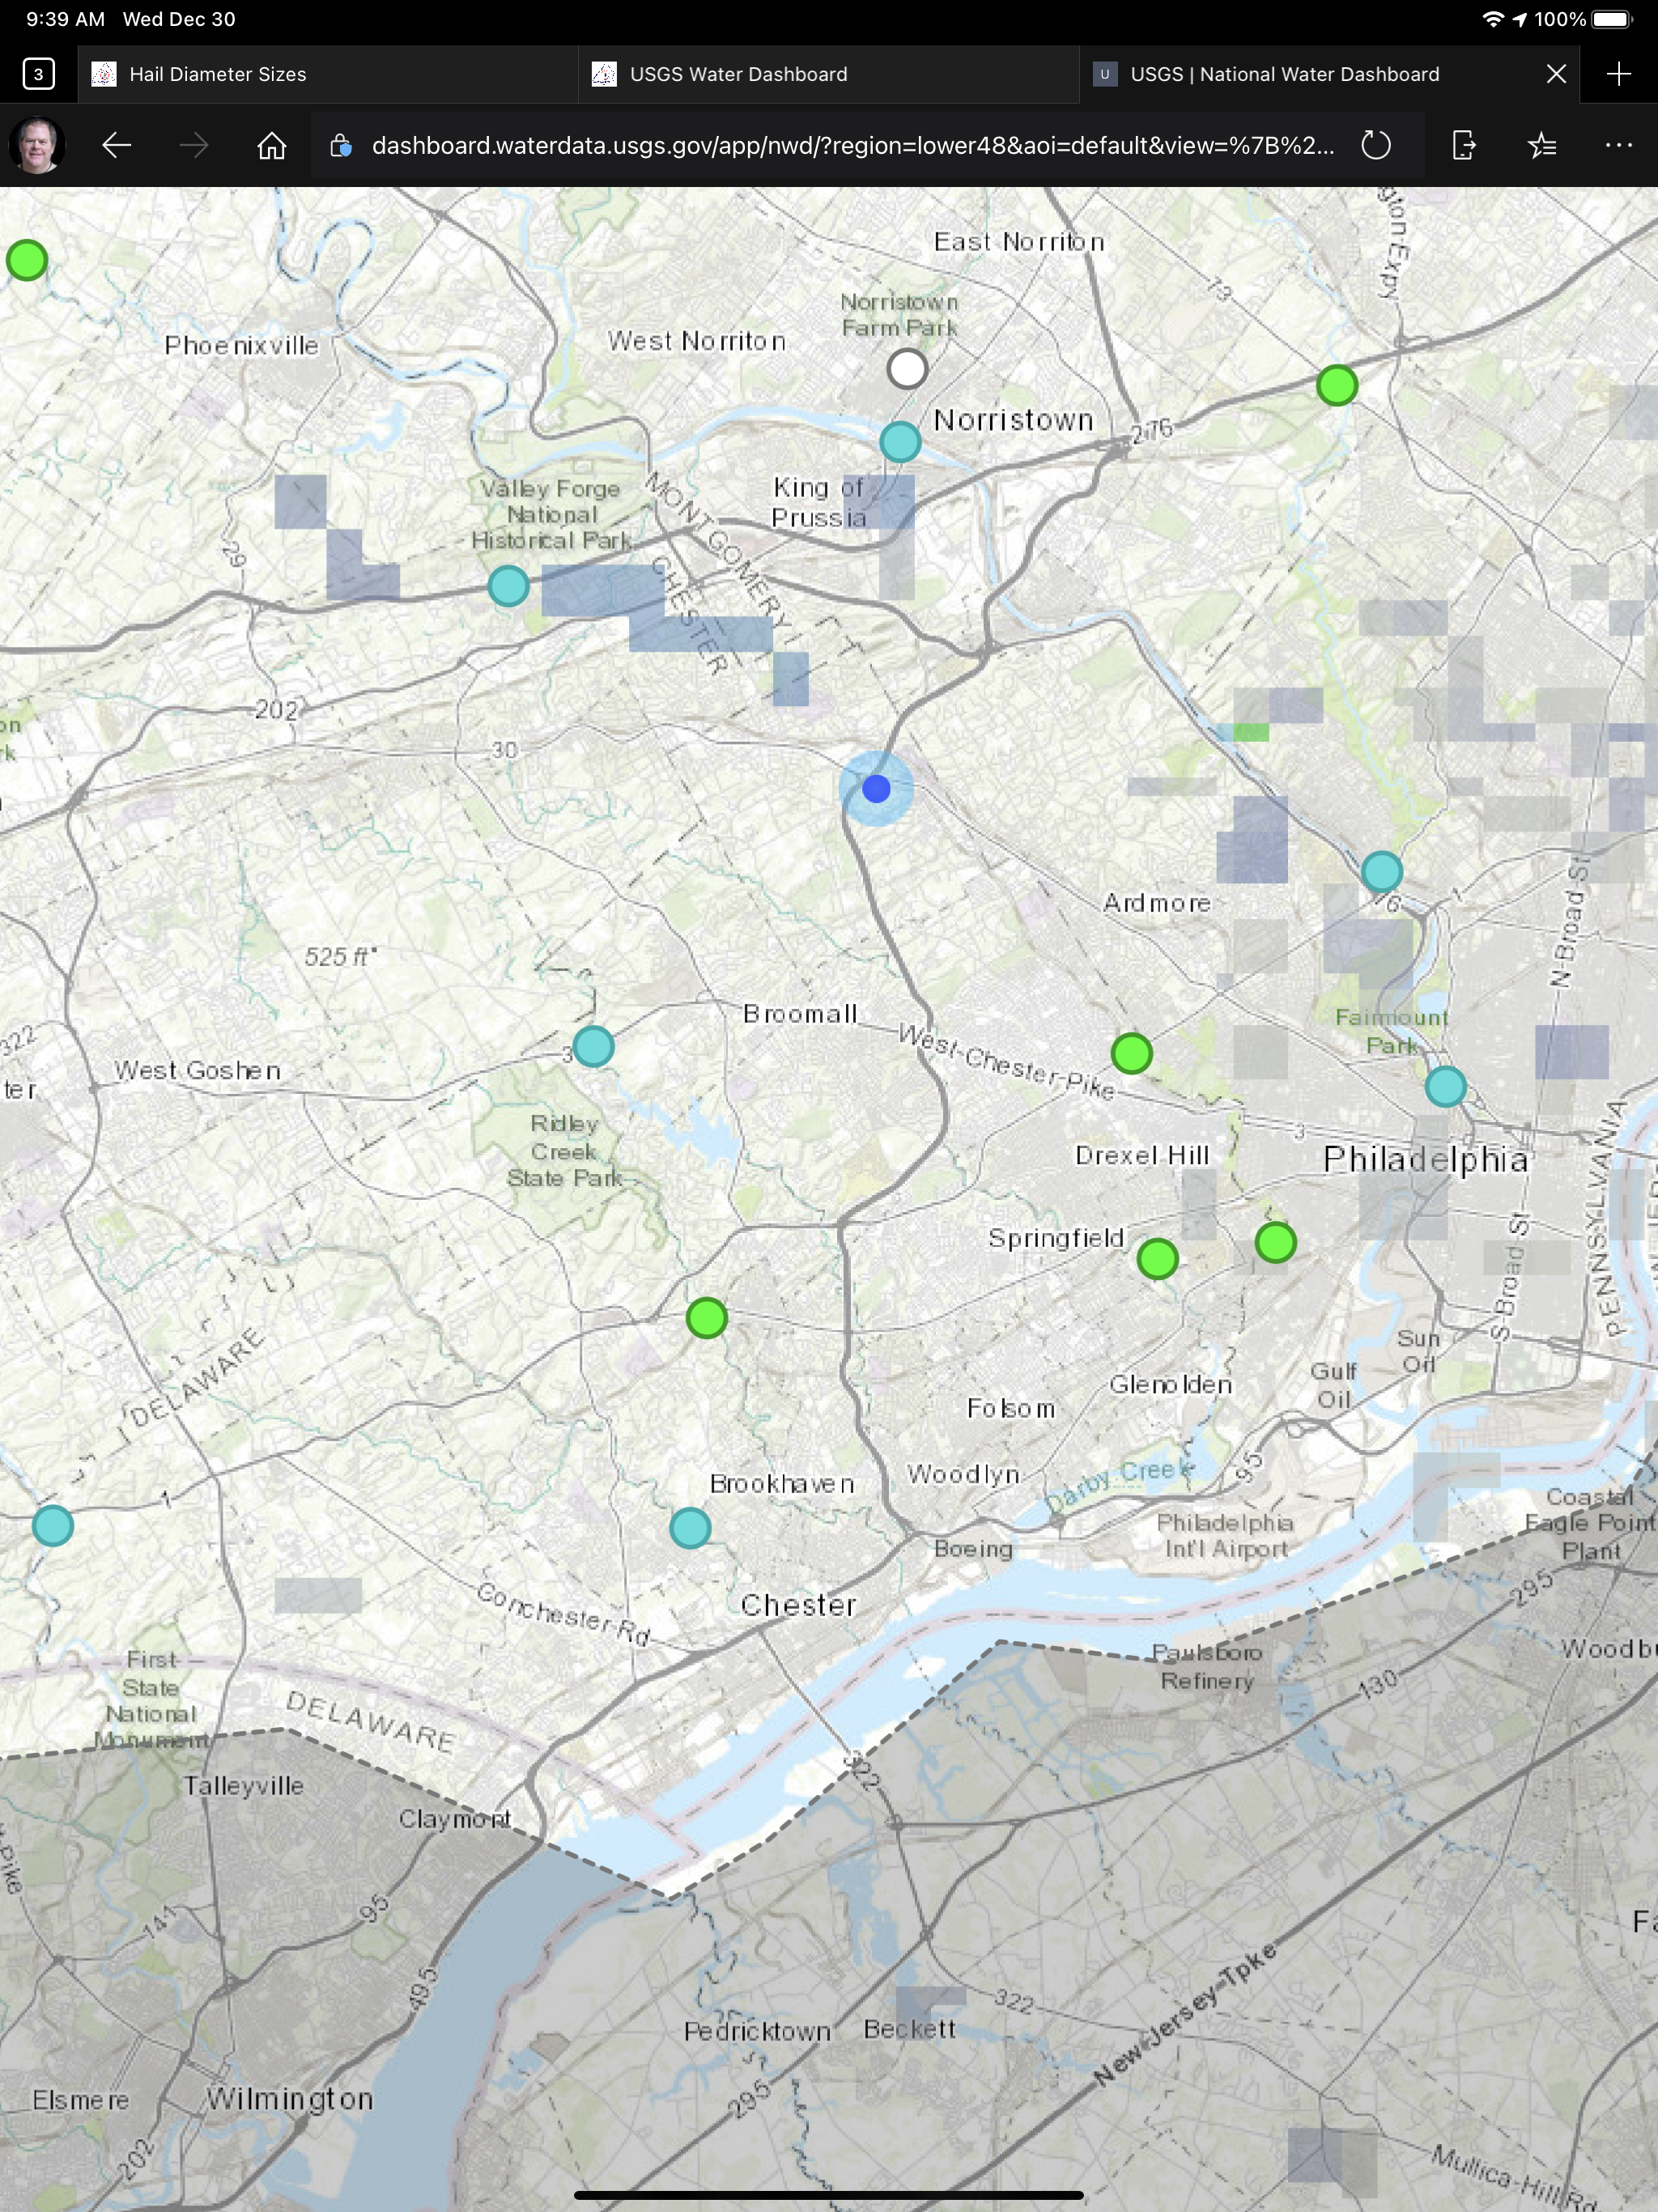
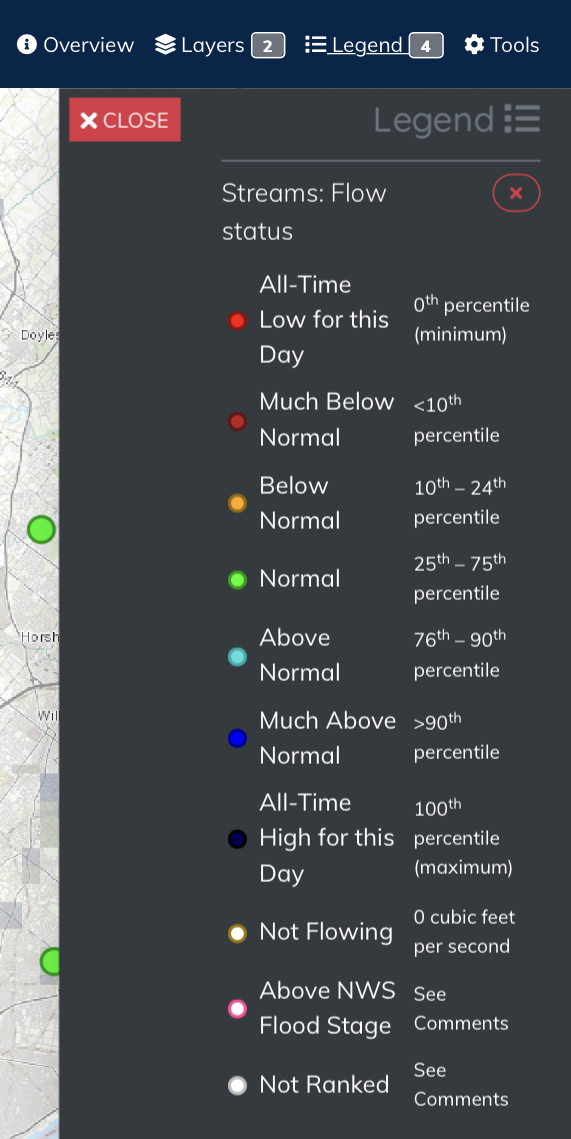
Each will be color coded to show current water flow. Most above are green, which is normal flow, but above normal is light blue, much above normal is blue and all-time highs are dark blue. Sites above NWS flood stage are circled in red, however only 1 or 2 sensors in Delaware County have defined flood stage levels, not all locations support this.
Details
If you click on a sensor location, you see a popup with more information. This includes the current discharge rate, sensor recording date/time, and may have notes if this rate is below/above normal and/or changing significantly since the last reading.
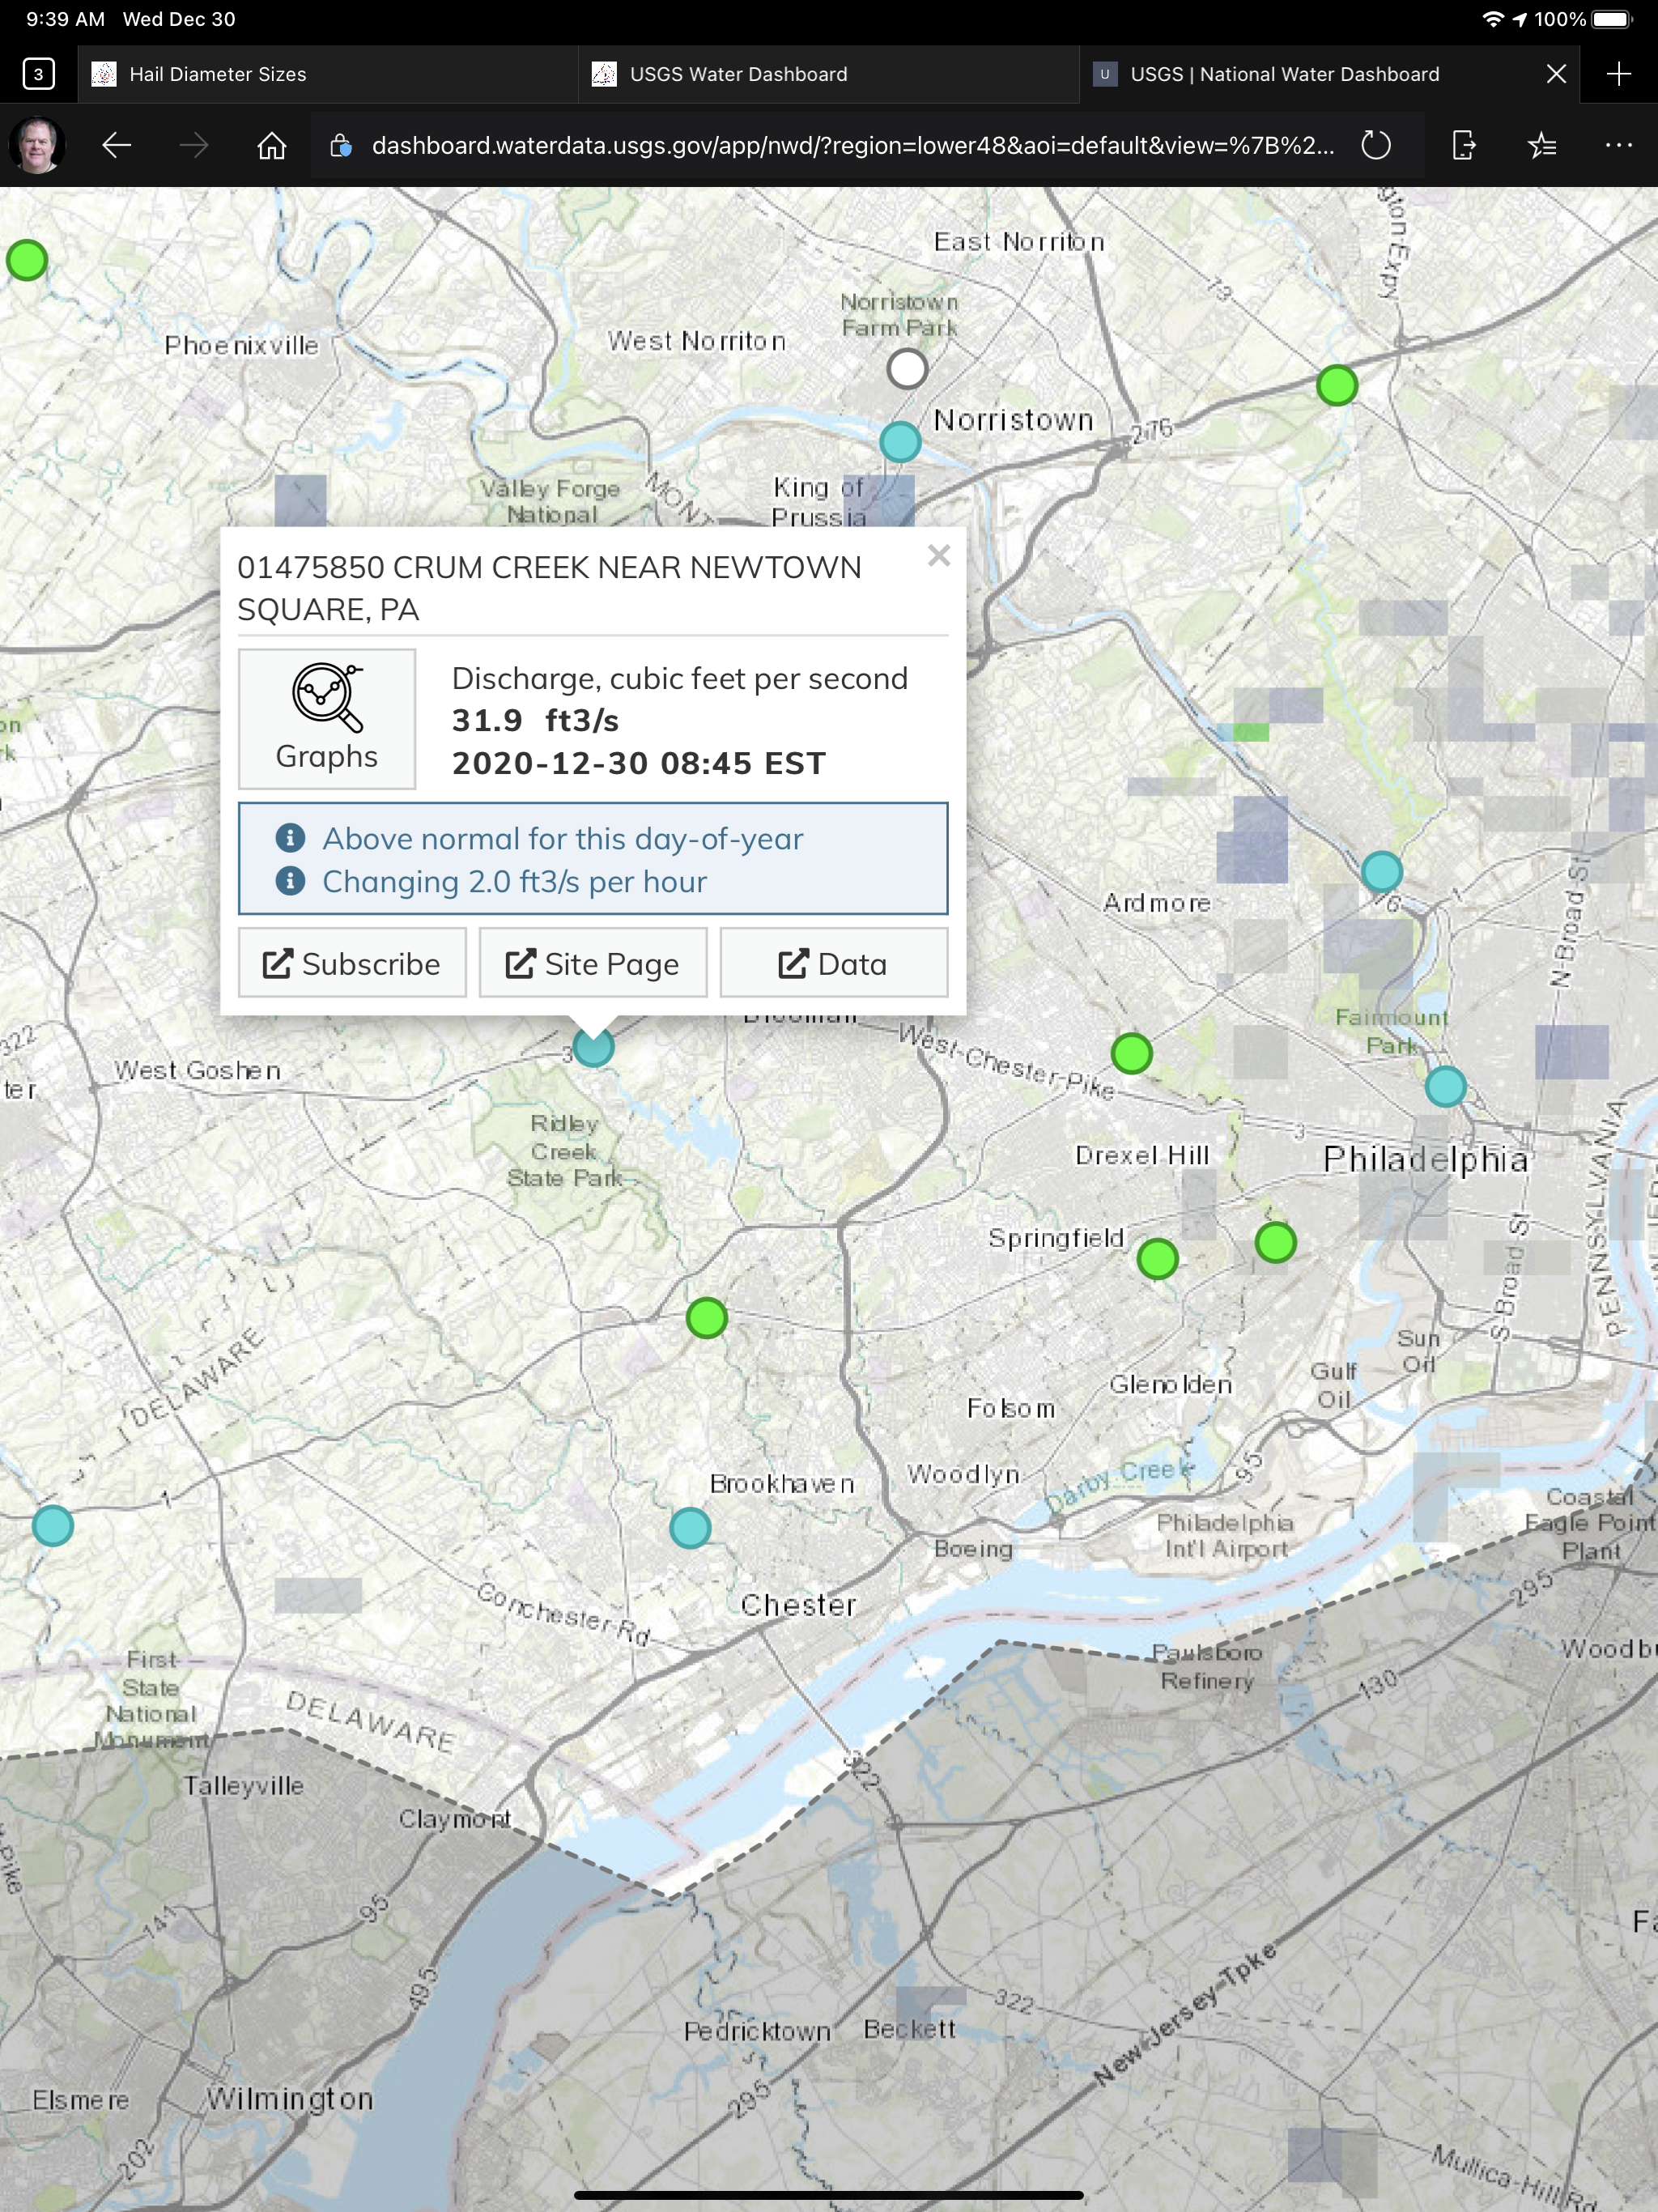
If you click on Subscribe, you can receive email or text alerts on a number of conditions that you can define yourself.
If you click on Site Page, you’ll be taken to the details for that site. Make sure to go to the new layout if prompted.
Site Page
So we have links to each site’s page here, or you can get to them from the details popup on the dashboard as well.
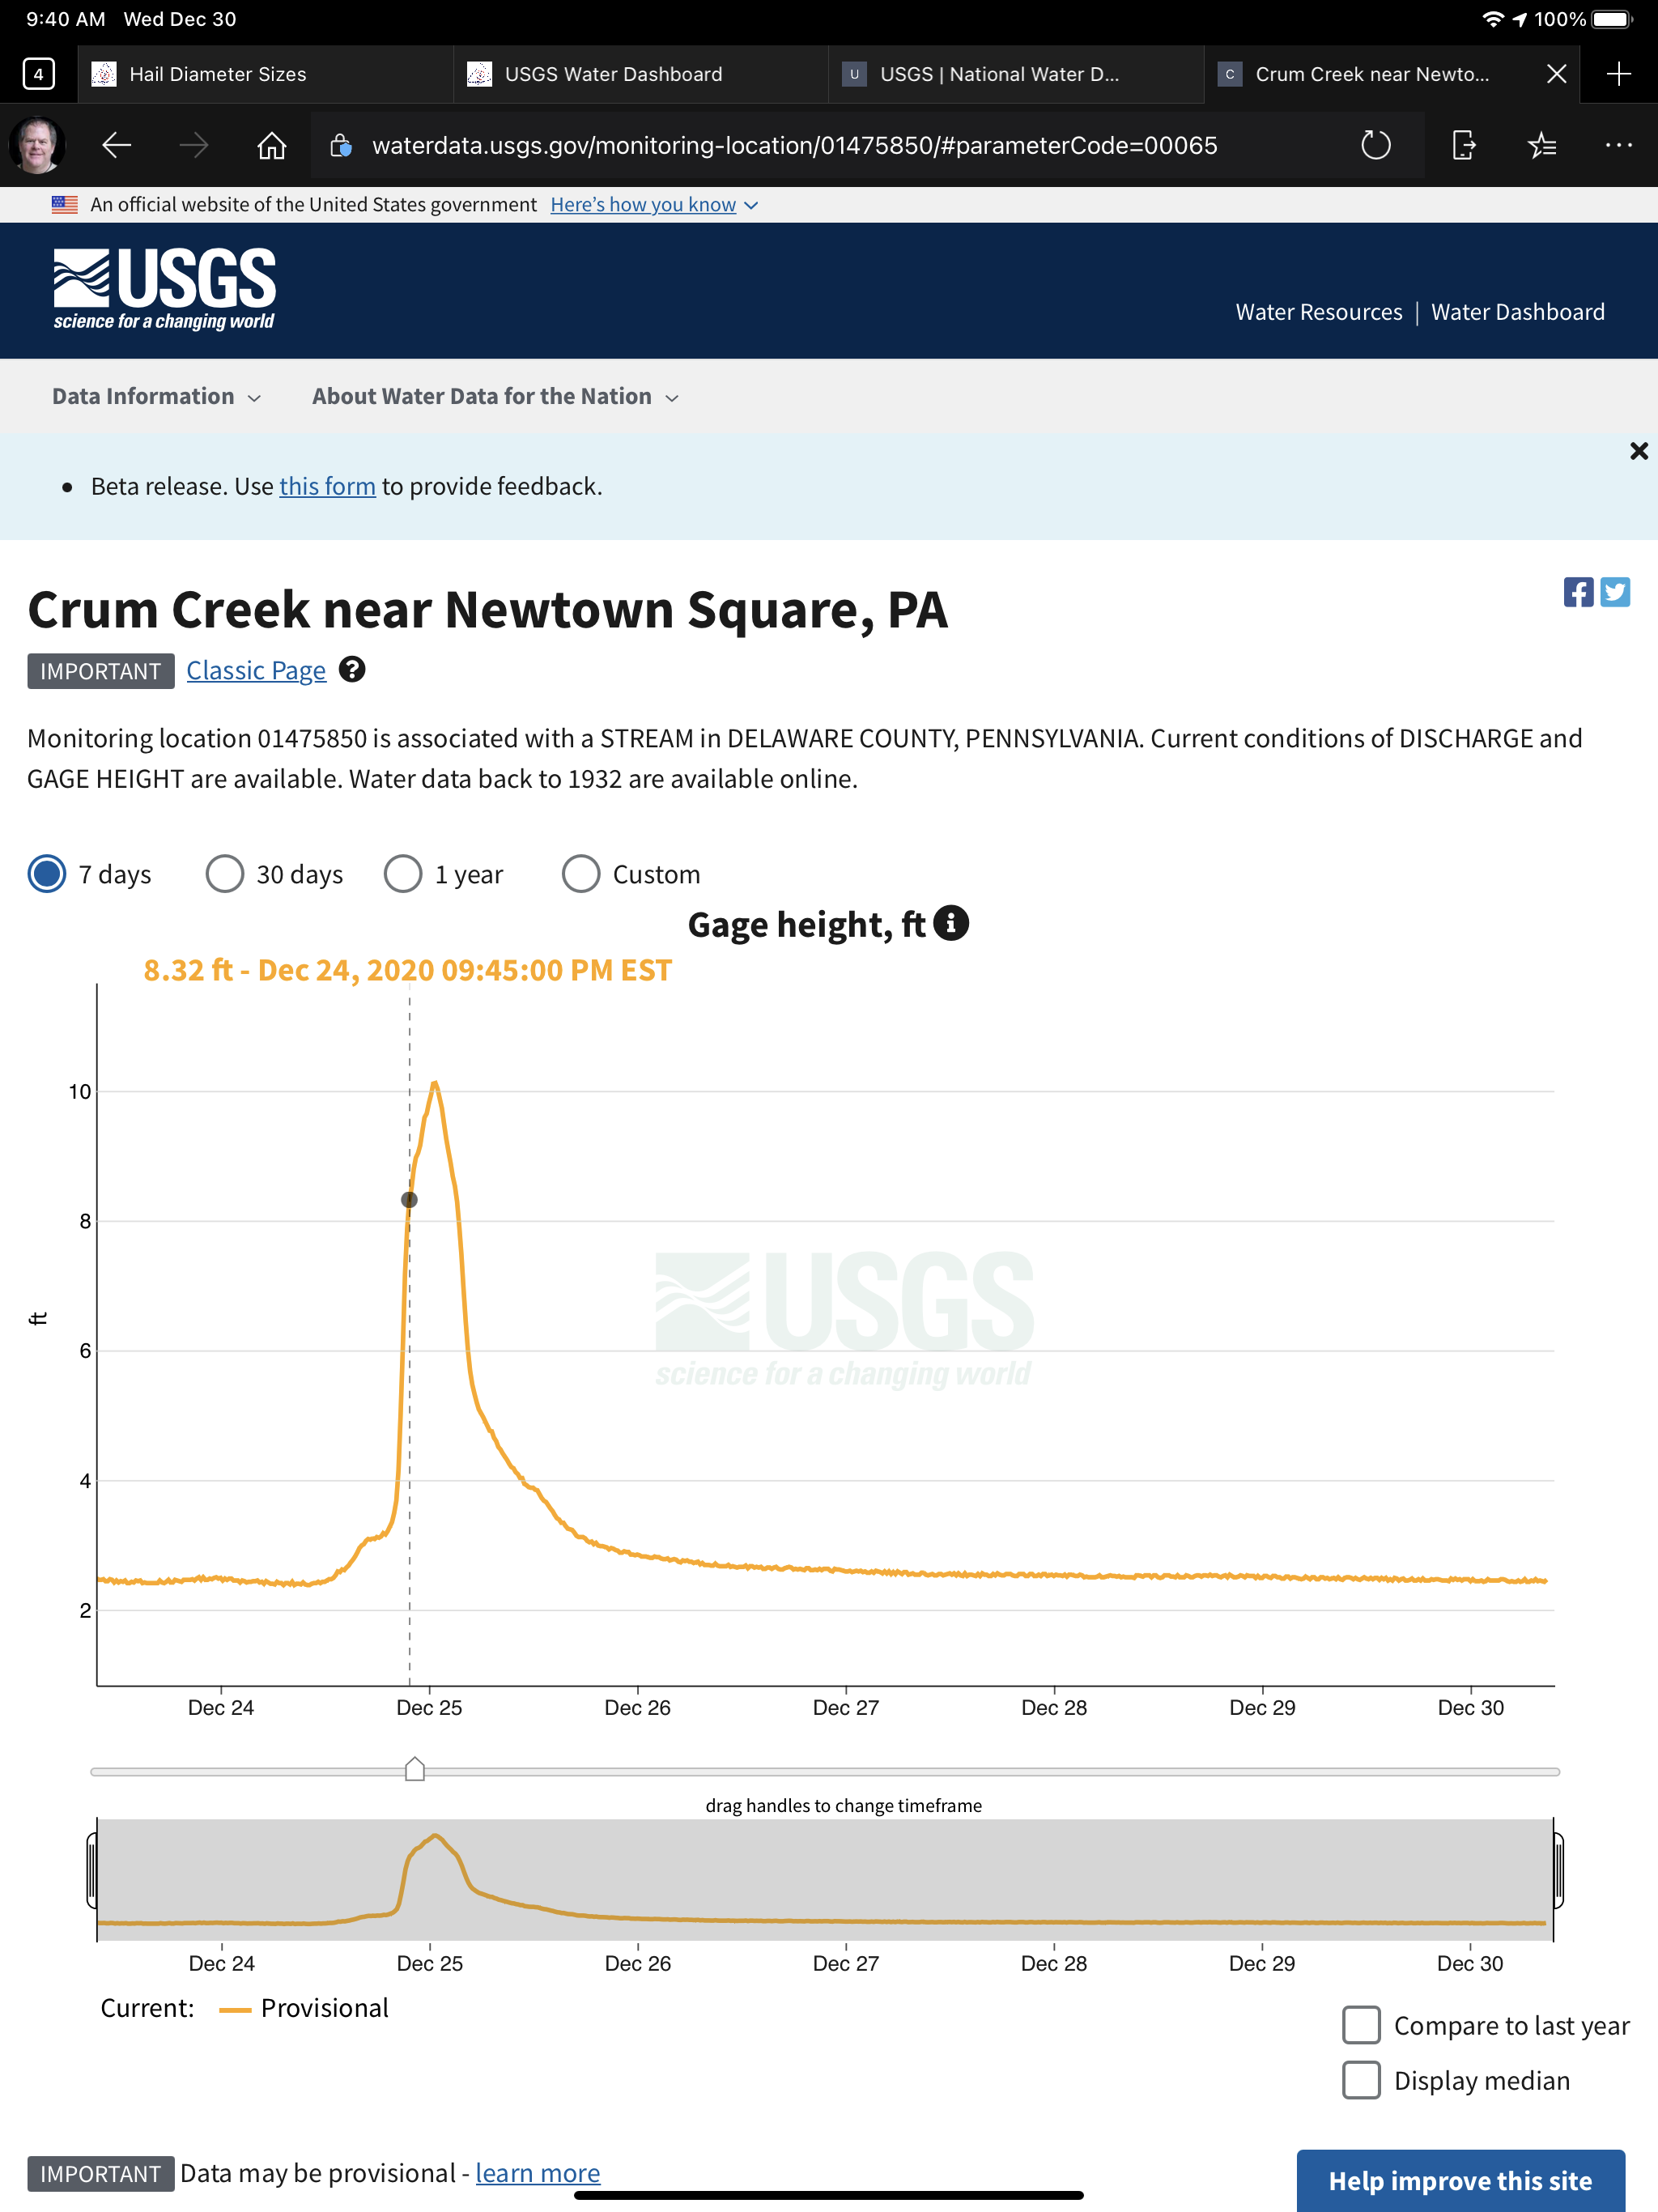
The site details will show options for a number of graphs (depending on what sensors are installed and collecting data), usually starting with the gage height over the last 7 days.
This sensor at Crum Creek near Newtown Square, PA clearly shows a significant jump in water height due to flooding conditions starting around the 9pm hour on December 24th, and dropping back to more normal levels a few hours later. One could have expected to have seen localized flooding in surrounding neighborhoods slightly preceding the times shown here.